Financial Information
- Top
- Investor Relations
- Financial Information
Consolidated Operating Results and Financial Status
| Items (Million of yen) |
FY2022 | FY2023 | FY2024 | FY2025 | FY2026 |
|---|---|---|---|---|---|
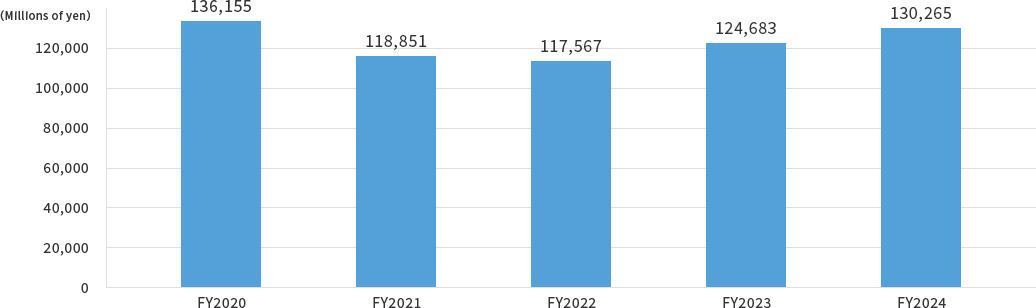
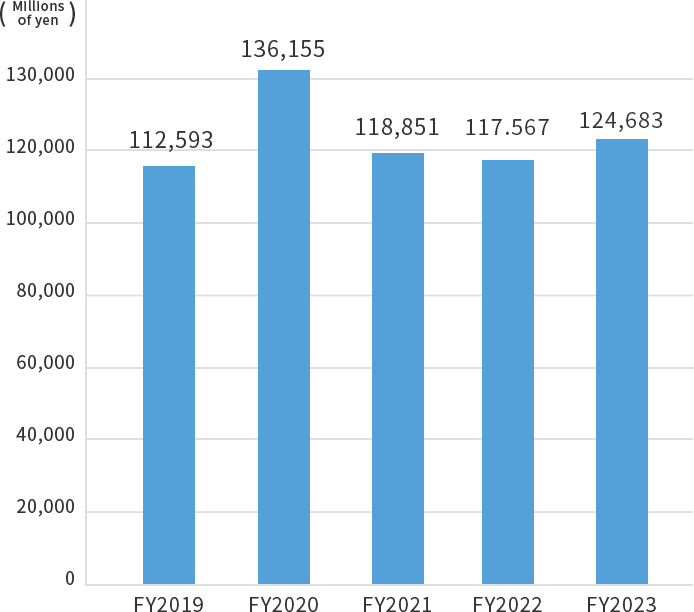
| Net Sales | 117,567 | 124,683 | 130,265 | 137,072 | 113,935 |
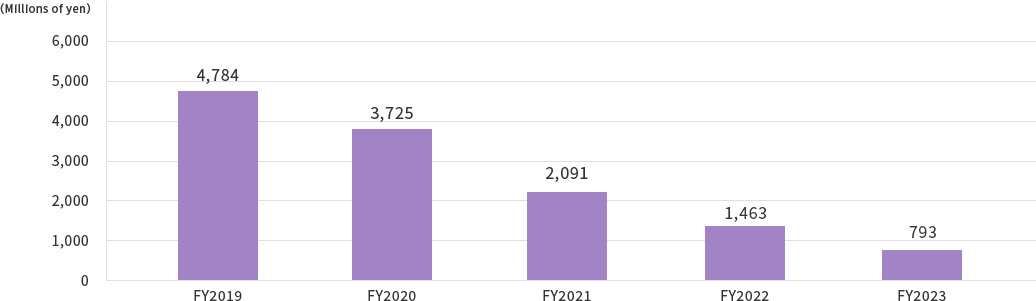
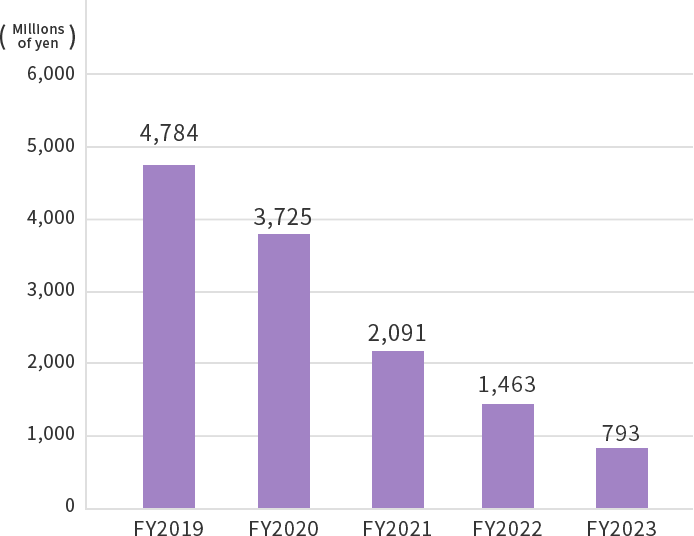
| Operating Income | 1,463 | 793 | 1,261 | 641 | 2,552 |
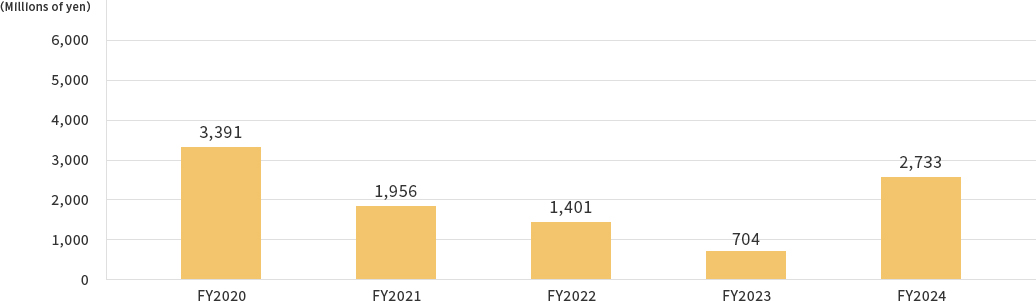
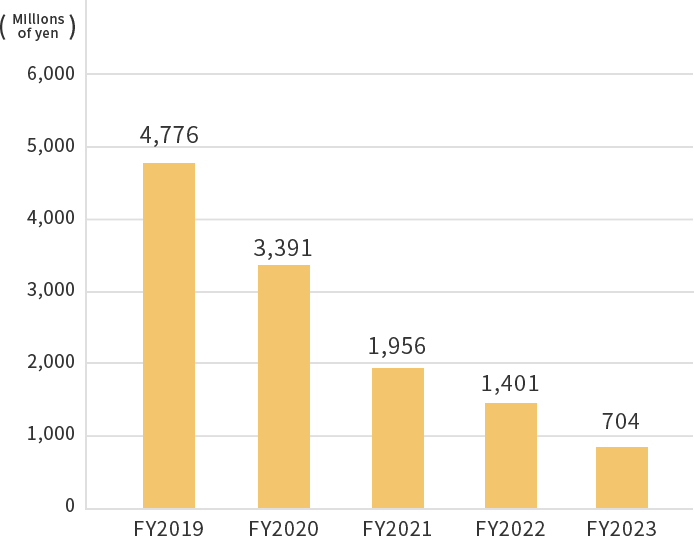
| Ordinary Income | 1,401 | 704 | 2,733 | 102 | 2,249 |
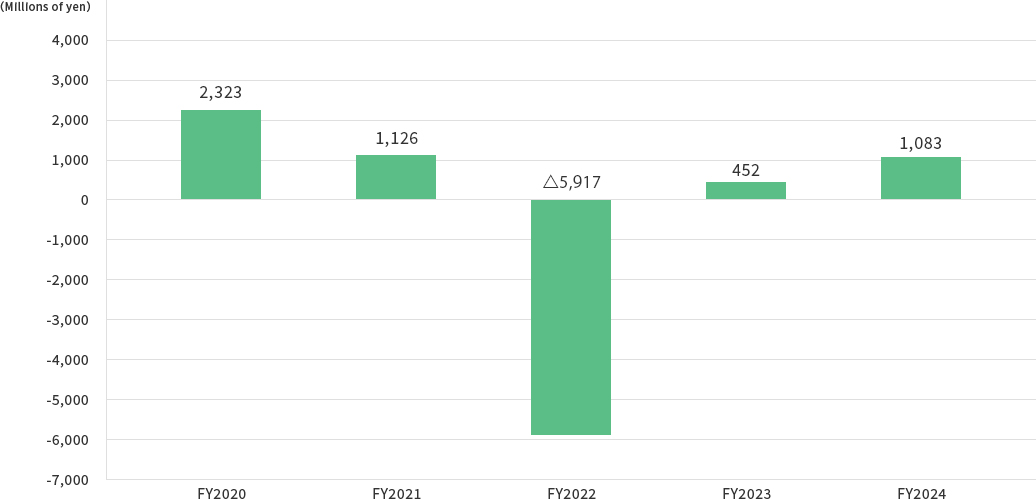
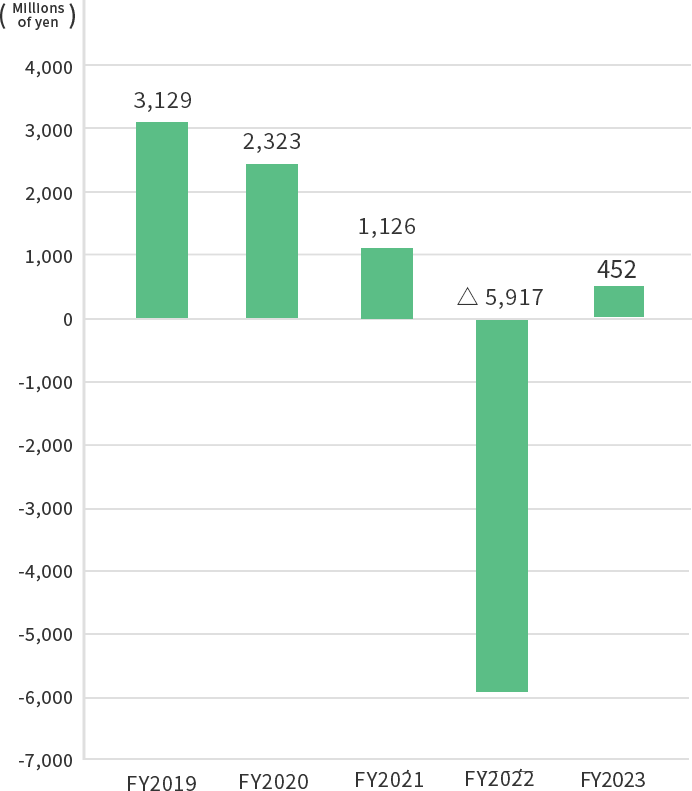
| Net Income Attributable to Owners of the Parent |
△5,917 | 452 | 1,083 | △6,282 | 2,147 |
| Net Income Attributable to Owners of the Parent per Share |
△130.99 | 10.00 | 23.90 | △138.28 | 47.15 |
| Total Assets | 143,308 | 145,175 | 146,473 | 136,238 | 122,355 |
| Net Assets | 58,242 | 58,464 | 56,821 | 49,670 | 50,945 |
| Shareholders Equity Ratio(%) |
40.1 | 39.8 | 38.3 | 35.9 | 41.0 |
| Net Assets per Share (yen) |
1,272.86 | 1,275.00 | 1,235.52 | 1,075.86 | 1,100.56 |
※Reverse stock split was carried out by consolidating two shares into one share with the effective date of October 1, 2016.
It was assumed that the shares were consolidated at the beginning of the term ended in March 2013 and the net income per share and net assets per share in this term were calculated accordingly.
Net Sales
Operating Income
Ordinary Income
Net Income Attributable to Owners of the Parent